Retrieve PostgreSQL variable-length storage information thanks to pageinspect

Introduction

In PostgreSQL a variable-length datatype value can be stored in-line or out-of-line (as a TOAST). It can also be compressed or not (see the documentation for more details).

Let’s make use of the pageinspect extension and the information about variable-length datatype found in postgres.h to build a query to retrieve tuples variable-length storage information.

The query

The query is the following:

$ cat toast_info.sql
select
t_ctid,
-- See postgres.h
CASE
  WHEN (fo is NULL) THEN 'null'
  -- VARATT_IS_EXTERNAL_ONDISK: VARATT_IS_EXTERNAL (fo = 'x01') && tag == VARTAG_ONDISK (x12)
  -- rawsize - VARHDRSZ > extsize
  WHEN (fo = 'x01') AND (tag = 'x12') AND (osize - 4 > ssize) THEN 'toasted (compressed)'
-- rawsize - VARHDRSZ <= extsize
  WHEN (fo = 'x01') AND (tag = 'x12') AND (osize - 4 <= ssize) THEN 'toasted (uncompressed)'
  -- VARATT_IS_EXTERNAL_INDIRECT: VARATT_IS_EXTERNAL && tag == VARTAG_INDIRECT (x01)
  WHEN (fo = 'x01') AND (tag = 'x01') then 'indirect in-memory'
  -- VARATT_IS_EXTERNAL_EXPANDED: VARATT_IS_EXTERNAL && VARTAG_IS_EXPANDED(VARTAG_EXTERNAL)
  WHEN (fo = 'x01') AND (tag = 'x02' OR tag = 'x03') then 'expanded in-memory'
  -- VARATT_IS_SHORT (va_header & 0x01) == 0x01)
  WHEN (fo & 'x01' = 'x01') THEN 'short in-line'
  -- VARATT_IS_COMPRESSED (va_header & 0x03) == 0x02)
  WHEN (fo & 'x03' = 'x02') THEN 'long in-line (compressed)'
  ELSE 'long in-line (uncompressed)'
END as toast_info
from
(
select
page_items.t_ctid,
substr(page_items.t_attrs[1]::text,2,3)::bit(8) as fo,
('x'||substr(page_items.t_attrs[1]::text,5,2))::bit(8) as tag,
('x'||regexp_replace(substr(page_items.t_attrs[1]::text,7,8),'(\w\w)(\w\w)(\w\w)(\w\w)','\4\3\2\1'))::bit(32)::int as osize ,
('x'||regexp_replace(substr(page_items.t_attrs[1]::text,15,8),'(\w\w)(\w\w)(\w\w)(\w\w)','\4\3\2\1'))::bit(32)::int as ssize
from
generate_series(0, pg_relation_size('bdttoast'::regclass::text) / 8192 - 1) blkno ,
heap_page_item_attrs(get_raw_page('bdttoast',blkno::int), 'bdttoast'::regclass) as page_items
) as hp;

As you can see, the query focus on the bdttoast table. Let’s create this table and put some data in it to see the query in action.

Let’s see the query in action

Let’s create this table:

postgres=# CREATE TABLE bdttoast ( message text );
CREATE TABLE

the message field storage type is “extended”:

postgres=# \d+ bdttoast
                                 Table "public.bdttoast"
 Column  | Type | Collation | Nullable | Default | Storage  | Stats target | Description
---------+------+-----------+----------+---------+----------+--------------+-------------
 message | text |           |          |         | extended |              |

extended allows both compression and out-of-line storage. This is the default for most TOAST-able data types. Compression will be attempted first, then out-of-line storage if the row is still too big.

let’s add one tuple:

postgres=# INSERT INTO bdttoast VALUES ('default');
INSERT 0 1

and check how the message field has been stored thanks to the query:

postgres=# \i toast_info.sql
 t_ctid |  toast_info
--------+---------------
 (0,1)  | short in-line
(1 row)

as you can see it has been stored in-line.

Add another tuple with more data in the message field, and check its storage information:

postgres=# INSERT INTO bdttoast VALUES (repeat('a',10000));
INSERT 0 1
postgres=# \i toast_info.sql
 t_ctid |        toast_info
--------+---------------------------
 (0,1)  | short in-line
 (0,2)  | long in-line (compressed)
(2 rows)

as you can see this field value has been stored as long in-line and is compressed.

Add another tuple with even more data in the message field, and check its storage information:

postgres=# INSERT INTO bdttoast VALUES (repeat('b',1000000));
INSERT 0 1
postgres=# \i toast_info.sql
 t_ctid |        toast_info
--------+---------------------------
 (0,1)  | short in-line
 (0,2)  | long in-line (compressed)
 (0,3)  | toasted (compressed)
(3 rows)

this time it has been stored as TOAST-ed and is compressed.

Let’s change the message column storage to external:

postgres=# ALTER TABLE bdttoast ALTER COLUMN message SET STORAGE EXTERNAL;
ALTER TABLE
postgres=# \d+ bdttoast
                                 Table "public.bdttoast"
 Column  | Type | Collation | Nullable | Default | Storage  | Stats target | Description
---------+------+-----------+----------+---------+----------+--------------+-------------
 message | text |           |          |         | external |              |

external means it allows out-of-line storage but not compression.

Now, let’s add 3 tuples with the same field message size as the 3 ones previously added and compare the storage information.

Let’s add one tuple with the same message size as the one previously stored as “short in-line”:

postgres=# INSERT INTO bdttoast VALUES ('externa');
INSERT 0 1
postgres=# \i toast_info.sql
 t_ctid |        toast_info
--------+---------------------------
 (0,1)  | short in-line
 (0,2)  | long in-line (compressed)
 (0,3)  | toasted (compressed)
 (0,4)  | short in-line
(4 rows)

this one is still short in-line (same as t_ctid (0,1)).

Let’s add one tuple with the same message size as the one previously stored as “long in-line (compressed)”:

postgres=# INSERT INTO bdttoast VALUES (repeat('c',10000));
INSERT 0 1
postgres=# \i toast_info.sql
 t_ctid |        toast_info
--------+---------------------------
 (0,1)  | short in-line
 (0,2)  | long in-line (compressed)
 (0,3)  | toasted (compressed)
 (0,4)  | short in-line
 (0,5)  | toasted (uncompressed)
(5 rows)

this one is TOAST-ed and uncompressed with storage external (as compare with t_ctid (0,2) with storage extended).

Let’s add one tuple with the same message size as the one previously stored as “toasted (compressed)”:

postgres=# INSERT INTO bdttoast VALUES (repeat('d',1000000));
INSERT 0 1
postgres=# \i toast_info.sql
 t_ctid |        toast_info
--------+---------------------------
 (0,1)  | short in-line
 (0,2)  | long in-line (compressed)
 (0,3)  | toasted (compressed)
 (0,4)  | short in-line
 (0,5)  | toasted (uncompressed)
 (0,6)  | toasted (uncompressed)
(6 rows)

this one is TOAST-ed and uncompressed with storage external (as compare with t_ctid (0,3) with storage extended).

Remarks

  • use this query on little-endian machines only (bit layouts would not be the same on big-endian and would impact the query accuracy)
  • t_attrs[1] is used in the query to retrieve the information. This is because the message field is the 1st of the relation

Conclusion

Thanks to the pageinspect extension we have been able to write a query to retrieve variable-length storage information. We have been able to compare how our data has been stored depending on the column storage being used (extended or external).

Get toast chunk_id from the user table tuples or from the toast index thanks to pageinspect

Introduction

TOAST stands for “The Oversized-Attribute Storage Technique” and allows to broke up large fields value into multiple physical rows (see the PostgreSQL documentation for more details).

The goal of this post is to provide a way to retrieve toast’s information from the user table tuples or from the toast index without querying the toast directly.

We will be able to link the user table tuples to the toast pages by using user table tuples and toast index data (not querying the toast at all).

Build the playground

Create a table with a TOAST-able field:

toasted=# CREATE TABLE bdttab (id int,message text,age int);
CREATE TABLE

toasted=# \d+ bdttab
                                   Table "public.bdttab"
 Column  |  Type   | Collation | Nullable | Default | Storage  | Stats target | Description
---------+---------+-----------+----------+---------+----------+--------------+-------------
 id      | integer |           |          |         | plain    |              |
 message | text    |           |          |         | extended |              |
 age     | integer |           |          |         | plain    |              |
Access method: heap

Insert 10 rows:

toasted=# INSERT INTO bdttab
SELECT 1,(SELECT
string_agg(chr(floor(random() * 26)::int + 65), '')
FROM generate_series(1,10000)),6
FROM generate_series(1,10);
INSERT 0 10

check the toast and toast index names:

toasted=# select r.relname,t.relname as toast,i.relname as toast_index from pg_class r, pg_class i, pg_index d, pg_class t where r.relname = 'bdttab' and d.indrelid = r.reltoastrelid and i.oid = d.indexrelid and t.oid = r.reltoastrelid;
relname | toast | toast_index
---------+-----------------+-----------------------
bdttab | pg_toast_192881 | pg_toast_192881_index
(1 row)

Retrieve the chunk_id for each tuple directly from the user table

The chunk_id is part of the tuple’s data as explained in this slide (coming from this presentation):

Note that the toast relation id is also part of the tuple data.

As you can see from the slide we can get the information with pageinspect, so let’s use it to build a query to retrieve the chunk_id and the toast relation id from the tuples:

create the extension:

toasted=# create extension pageinspect;
CREATE EXTENSION

and query the user table to get the information:

toasted=# select
page_item_attrs.t_ctid,
page_item_attrs.t_attrs[2],
substr(substr(page_item_attrs.t_attrs[2],octet_length(page_item_attrs.t_attrs[2])-7,4)::text,3) as substr_for_chunk_id,
('x'||regexp_replace(substr(substr(page_item_attrs.t_attrs[2],octet_length(page_item_attrs.t_attrs[2])-7,4)::text,3),'(\w\w)(\w\w)(\w\w)(\w\w)','\4\3\2\1'))::bit(32)::int as chunk_id,
substr(substr(page_item_attrs.t_attrs[2],octet_length(page_item_attrs.t_attrs[2])-3,4)::text,3) as substr_for_toast_relid,
('x'||regexp_replace(substr(substr(page_item_attrs.t_attrs[2],octet_length(page_item_attrs.t_attrs[2])-3,4)::text,3),'(\w\w)(\w\w)(\w\w)(\w\w)','\4\3\2\1'))::bit(32)::int as toast_relid
FROM
generate_series(0, pg_relation_size('bdttab'::regclass::text) / 8192 - 1) blkno ,
heap_page_item_attrs(get_raw_page('bdttab', blkno::int), 'bdttab'::regclass) as page_item_attrs
where
substr(page_item_attrs.t_attrs[2]::text,3,2)='01';
 t_ctid |                t_attrs                 | substr_for_chunk_id | chunk_id | substr_for_toast_relid | toast_relid
--------+----------------------------------------+---------------------+----------+------------------------+-------------
 (0,1)  | \x0112142700001027000077f1020074f10200 | 77f10200            |   192887 | 74f10200               |      192884
 (0,2)  | \x0112142700001027000078f1020074f10200 | 78f10200            |   192888 | 74f10200               |      192884
 (0,3)  | \x0112142700001027000079f1020074f10200 | 79f10200            |   192889 | 74f10200               |      192884
 (0,4)  | \x011214270000102700007af1020074f10200 | 7af10200            |   192890 | 74f10200               |      192884
 (0,5)  | \x011214270000102700007bf1020074f10200 | 7bf10200            |   192891 | 74f10200               |      192884
 (0,6)  | \x011214270000102700007cf1020074f10200 | 7cf10200            |   192892 | 74f10200               |      192884
 (0,7)  | \x011214270000102700007df1020074f10200 | 7df10200            |   192893 | 74f10200               |      192884
 (0,8)  | \x011214270000102700007ef1020074f10200 | 7ef10200            |   192894 | 74f10200               |      192884
 (0,9)  | \x011214270000102700007ff1020074f10200 | 7ff10200            |   192895 | 74f10200               |      192884
 (0,10) | \x0112142700001027000080f1020074f10200 | 80f10200            |   192896 | 74f10200               |      192884
(10 rows)

as you can see we are able to get the chunk_id and the toast relation id from the tuples.

Let’s verify that those values make sense, first checking the toast relation id:

toasted=# select relname from pg_class where oid=192884;
     relname
-----------------
 pg_toast_192881
(1 row)

and then checking the chunk_ids from the toast itself:

toasted=# select distinct(chunk_id) from pg_toast.pg_toast_192881;
 chunk_id
----------
   192894
   192895
   192889
   192888
   192893
   192892
   192896
   192891
   192887
   192890
(10 rows)

The values match the ones we got directly from the user table tuples.

Retrieve the chunk_id and chunk_seq directly from the toast index

The toast index contains those information, so let’s query it too:

toasted=# select
page_items.ctid,
page_items.data,
('x'||regexp_replace(substr(page_items.data,1,11),'(\w\w) (\w\w) (\w\w) (\w\w)','\4\3\2\1'))::bit(32)::int as chunk_id,
('x'||regexp_replace(substr(page_items.data,13,23),'(\w\w) (\w\w) (\w\w) (\w\w)','\4\3\2\1'))::bit(32)::int as chunk_seq
FROM
generate_series(1, pg_relation_size('pg_toast.pg_toast_192881_index'::regclass::text) / 8192 - 1) blkno ,
bt_page_items('pg_toast.pg_toast_192881_index', blkno::int) as page_items;

  ctid  |          data           | chunk_id | chunk_seq
--------+-------------------------+----------+-----------
 (0,1)  | 77 f1 02 00 00 00 00 00 |   192887 |         0
 (0,2)  | 77 f1 02 00 01 00 00 00 |   192887 |         1
 (0,3)  | 77 f1 02 00 02 00 00 00 |   192887 |         2
 (0,4)  | 77 f1 02 00 03 00 00 00 |   192887 |         3
 (1,1)  | 77 f1 02 00 04 00 00 00 |   192887 |         4
 (1,2)  | 77 f1 02 00 05 00 00 00 |   192887 |         5
 (1,3)  | 78 f1 02 00 00 00 00 00 |   192888 |         0
 (1,4)  | 78 f1 02 00 01 00 00 00 |   192888 |         1
 (2,1)  | 78 f1 02 00 02 00 00 00 |   192888 |         2
 (2,2)  | 78 f1 02 00 03 00 00 00 |   192888 |         3
 (2,3)  | 78 f1 02 00 04 00 00 00 |   192888 |         4
 (2,4)  | 78 f1 02 00 05 00 00 00 |   192888 |         5
 (3,1)  | 79 f1 02 00 00 00 00 00 |   192889 |         0
 (3,2)  | 79 f1 02 00 01 00 00 00 |   192889 |         1
 (3,3)  | 79 f1 02 00 02 00 00 00 |   192889 |         2
 (3,4)  | 79 f1 02 00 03 00 00 00 |   192889 |         3
 (4,1)  | 79 f1 02 00 04 00 00 00 |   192889 |         4
 (4,2)  | 79 f1 02 00 05 00 00 00 |   192889 |         5
 (4,3)  | 7a f1 02 00 00 00 00 00 |   192890 |         0
 (4,4)  | 7a f1 02 00 01 00 00 00 |   192890 |         1
 (5,1)  | 7a f1 02 00 02 00 00 00 |   192890 |         2
 (5,2)  | 7a f1 02 00 03 00 00 00 |   192890 |         3
.
.
.
 (12,3) | 7f f1 02 00 02 00 00 00 |   192895 |         2
 (12,4) | 7f f1 02 00 03 00 00 00 |   192895 |         3
 (13,1) | 7f f1 02 00 04 00 00 00 |   192895 |         4
 (13,2) | 7f f1 02 00 05 00 00 00 |   192895 |         5
 (13,3) | 80 f1 02 00 00 00 00 00 |   192896 |         0
 (13,4) | 80 f1 02 00 01 00 00 00 |   192896 |         1
 (14,1) | 80 f1 02 00 02 00 00 00 |   192896 |         2
 (14,2) | 80 f1 02 00 03 00 00 00 |   192896 |         3
 (14,3) | 80 f1 02 00 04 00 00 00 |   192896 |         4
 (14,4) | 80 f1 02 00 05 00 00 00 |   192896 |         5
(60 rows)

Note that the chunk_ids coming from the index, the user table tuples and the toast itself match.

Use case example: a toast’s page is corrupted and I want to know which tuples from the user table are affected

Say the page 12 of the toast is corrupted, then we could get the affected chunk_id and chunk_seq from the toast index that way (by filtering on the ctid):

toasted=# select
page_items.ctid,
page_items.data,
('x'||regexp_replace(substr(page_items.data,1,11),'(\w\w) (\w\w) (\w\w) (\w\w)','\4\3\2\1'))::bit(32)::int as chunk_id,
('x'||regexp_replace(substr(page_items.data,13,23),'(\w\w) (\w\w) (\w\w) (\w\w)','\4\3\2\1'))::bit(32)::int as chunk_seq
FROM
generate_series(1, pg_relation_size('pg_toast.pg_toast_192881_index'::regclass::text) / 8192 - 1) blkno ,
bt_page_items('pg_toast.pg_toast_192881_index', blkno::int) as page_items where ctid::text like '(12,%';

  ctid  |          data           | chunk_id | chunk_seq
--------+-------------------------+----------+-----------
 (12,1) | 7f f1 02 00 00 00 00 00 |   192895 |         0
 (12,2) | 7f f1 02 00 01 00 00 00 |   192895 |         1
 (12,3) | 7f f1 02 00 02 00 00 00 |   192895 |         2
 (12,4) | 7f f1 02 00 03 00 00 00 |   192895 |         3
(4 rows)

And then look back at the user table tuples that way by filtering on the chunk_id:

toasted=# select
page_item_attrs.t_ctid,
page_item_attrs.t_attrs[2],
substr(substr(page_item_attrs.t_attrs[2],octet_length(page_item_attrs.t_attrs[2])-7,4)::text,3) as substr_for_chunk_id,
('x'||regexp_replace(substr(substr(page_item_attrs.t_attrs[2],octet_length(page_item_attrs.t_attrs[2])-7,4)::text,3),'(\w\w)(\w\w)(\w\w)(\w\w)','\4\3\2\1'))::bit(32)::int as chunk_id,
substr(substr(page_item_attrs.t_attrs[2],octet_length(page_item_attrs.t_attrs[2])-3,4)::text,3) as substr_for_toast_relid,
('x'||regexp_replace(substr(substr(page_item_attrs.t_attrs[2],octet_length(page_item_attrs.t_attrs[2])-3,4)::text,3),'(\w\w)(\w\w)(\w\w)(\w\w)','\4\3\2\1'))::bit(32)::int as toast_relid
FROM
generate_series(0, pg_relation_size('bdttab'::regclass::text) / 8192 - 1) blkno ,
heap_page_item_attrs(get_raw_page('bdttab', blkno::int), 'bdttab'::regclass) as page_item_attrs
where
substr(page_item_attrs.t_attrs[2]::text,3,2)='01' and ('x'||regexp_replace(substr(substr(page_item_attrs.t_attrs[2],octet_length(page_item_attrs.t_attrs[2])-7,4)::text,3),'(\w\w)(\w\w)(\w\w)(\w\w)','\4\3\2\1'))::bit(32)::int = 192895;

 t_ctid |                t_attrs                 | substr_for_chunk_id | chunk_id | substr_for_toast_relid | toast_relid
--------+----------------------------------------+---------------------+----------+------------------------+-------------
 (0,9)  | \x011214270000102700007ff1020074f10200 | 7ff10200            |   192895 | 74f10200               |      192884
(1 row)

so that we know that this tuple with ctid (0,9) is linked to the corrupted toast page.

Remarks

  • t_attrs[2] is used in the query to retrieve the information from the user table. This is because the TOAST-able field (message) is the 2nd of the relation.
  • substr(page_item_attrs.t_attrs[2]::text,3,2)=’01’ is used to filter the user table tuples information. This is because 0x01 is used as TOASTed string marker (see the slide).

Conclusion

Thanks to pageinspect we have been able to retrieve the chunk_id directly from the user table tuples. We also have been able to link the user table tuples to the toast pages by using user table tuples and toast index data (not querying the toast at all).

Sampling pg_stat_statements based on the active sessions and their associated queryid

Introduction

Now that we have the ability to sample and record the active sessions and their associated queryid with the pg_active_session_history view (see this blog post), it would be interesting to have insights about the queries statistics at the time the sessions were active.

PostgreSQL provides the queries statistics with the pg_stat_statements view. We could query the pg_active_session_history and the pg_stat_statements views and join them on the queryid field, but the queries statistics would be:

  • cumulative
  • the ones at the time we would launch this query

So it would not provide the queries statistics at the time the sessions were active.

What’s new?

To get more granular queries statistics, the pgsentinel extension has evolved so that it now samples the pg_stat_statements:

  • at the same time it is sampling the active sessions
  • only for the queryid that were associated to an active session (if any) during the sampling

The samples are recorded into a new pg_stat_statements_history view.

This view looks like:

                    View "public.pg_stat_statements_history"
       Column        |           Type           | Collation | Nullable | Default 
---------------------+--------------------------+-----------+----------+---------
 ash_time            | timestamp with time zone |           |          | 
 userid              | oid                      |           |          | 
 dbid                | oid                      |           |          | 
 queryid             | bigint                   |           |          | 
 calls               | bigint                   |           |          | 
 total_time          | double precision         |           |          | 
 rows                | bigint                   |           |          | 
 shared_blks_hit     | bigint                   |           |          | 
 shared_blks_read    | bigint                   |           |          | 
 shared_blks_dirtied | bigint                   |           |          | 
 shared_blks_written | bigint                   |           |          | 
 local_blks_hit      | bigint                   |           |          | 
 local_blks_read     | bigint                   |           |          | 
 local_blks_dirtied  | bigint                   |           |          | 
 local_blks_written  | bigint                   |           |          | 
 temp_blks_read      | bigint                   |           |          | 
 temp_blks_written   | bigint                   |           |          | 
 blk_read_time       | double precision         |           |          | 
 blk_write_time      | double precision         |           |          | 

Remarks:

  • The fields description are the same as for pg_stat_statements (except for the ash_time one, which is the time of the active session history sampling)
  • As for pg_active_sessions_history, the pg_stat_statements_history view is implemented as in-memory ring buffer where the number of samples to be kept is configurable (thanks to the pgsentinel_pgssh.max_entries parameter)
  • The data collected are still cumulative metrics but you can make use of the window functions in PostgreSQL to compute the delta between samples (and then get accurate statistics for the queries between two samples)

For example, we could get per queryid and ash_time:  the rows per second, calls per second and rows per call that way:

select ash_time,queryid,delta_rows/seconds "rows_per_second",delta_calls/seconds "calls_per_second",delta_rows/delta_calls "rows_per_call"
from(
SELECT ash_time,queryid,
EXTRACT(EPOCH FROM ash_time::timestamp) - lag (EXTRACT(EPOCH FROM ash_time::timestamp))
OVER (
        PARTITION BY pgssh.queryid
        ORDER BY ash_time
        ASC) as "seconds",
rows-lag(rows)
        OVER (
        PARTITION BY pgssh.queryid
        ORDER BY ash_time
        ASC) as "delta_rows",
calls-lag(calls)
        OVER (
        PARTITION BY pgssh.queryid
        ORDER BY ash_time
        ASC) as "delta_calls"
    FROM pg_stat_statements_history pgssh) as delta
where delta_calls > 0 and seconds > 0
order by ash_time desc;

           ash_time            |      queryid       | rows_per_second  | calls_per_second | rows_per_call
-------------------------------+--------------------+------------------+------------------+----------------
 2019-07-06 11:09:48.629218+00 | 250416904599144140 | 10322.0031121842 | 10322.0031121842 |              1
 2019-07-06 11:09:47.627184+00 | 250416904599144140 | 10331.3930170891 | 10331.3930170891 |              1
 2019-07-06 11:09:46.625383+00 | 250416904599144140 | 10257.7574710211 | 10257.7574710211 |              1
 2019-07-06 11:09:42.620219+00 | 250416904599144140 |  10296.311364551 |  10296.311364551 |              1
 2019-07-06 11:09:41.618404+00 | 250416904599144140 | 10271.6737455877 | 10271.6737455877 |              1
 2019-07-06 11:09:36.612209+00 | 250416904599144140 | 10291.1563299622 | 10291.1563299622 |              1
 2019-07-06 11:09:35.610378+00 | 250416904599144140 | 10308.9798914136 | 10308.9798914136 |              1
 2019-07-06 11:09:33.607367+00 | 250416904599144140 |  10251.230955397 |  10251.230955397 |              1
 2019-07-06 11:09:31.604193+00 | 250416904599144140 | 10284.3551339058 | 10284.3551339058 |              1
 2019-07-06 11:09:30.60238+00  | 250416904599144140 | 10277.4631222064 | 10277.4631222064 |              1
 2019-07-06 11:09:24.595353+00 | 250416904599144140 | 10283.3919912856 | 10283.3919912856 |              1
 2019-07-06 11:09:22.59222+00  | 250416904599144140 | 10271.3534800552 | 10271.3534800552 |              1
 2019-07-06 11:09:21.59021+00  | 250416904599144140 | 10300.1104655978 | 10300.1104655978 |              1
 2019-07-06 11:09:20.588376+00 | 250416904599144140 | 10343.9790974522 | 10343.9790974522 |              1
 2019-07-06 11:09:16.583341+00 | 250416904599144140 | 10276.5525289304 | 10276.5525289304 |              1
  • it’s a good practice to normalize the statistics per second (as the sampling interval might change)
  • With that level of information we can understand the database activity in the past (thanks to the active sessions sampling) and get statistics per query at the time they were active
  • pgsentinel is available in this github repository

Conclusion

The pgsentinel extension now provides:

  • Active session history (through the pg_active_session_history view)
  • Queries statistics history (through the pg_stat_statements_history view), recorded at the exact same time as their associated active sessions

Active Session History in PostgreSQL: blocker and wait chain

While the active session history extension for PostgreSQL is still in beta, some information is added to it.

The pg_active_session_history view is currently made of:

                   View "public.pg_active_session_history"
      Column      |           Type           | Collation | Nullable | Default
------------------+--------------------------+-----------+----------+---------
 ash_time         | timestamp with time zone |           |          |
 datid            | oid                      |           |          |
 datname          | text                     |           |          |
 pid              | integer                  |           |          |
 usesysid         | oid                      |           |          |
 usename          | text                     |           |          |
 application_name | text                     |           |          |
 client_addr      | text                     |           |          |
 client_hostname  | text                     |           |          |
 client_port      | integer                  |           |          |
 backend_start    | timestamp with time zone |           |          |
 xact_start       | timestamp with time zone |           |          |
 query_start      | timestamp with time zone |           |          |
 state_change     | timestamp with time zone |           |          |
 wait_event_type  | text                     |           |          |
 wait_event       | text                     |           |          |
 state            | text                     |           |          |
 backend_xid      | xid                      |           |          |
 backend_xmin     | xid                      |           |          |
 top_level_query  | text                     |           |          |
 query            | text                     |           |          |
 cmdtype          | text                     |           |          |
 queryid          | bigint                   |           |          |
 backend_type     | text                     |           |          |
 blockers         | integer                  |           |          |
 blockerpid       | integer                  |           |          |
 blocker_state    | text                     |           |          |

You could see it as samplings of pg_stat_activity providing more information:

  • ash_time: the sampling time
  • top_level_query: the top level statement (in case PL/pgSQL is used)
  • query: the statement being executed (not normalised, as it is in pg_stat_statements, means you see the values)
  • cmdtype: the statement type (SELECT,UPDATE,INSERT,DELETE,UTILITY,UNKNOWN,NOTHING)
  • queryid: the queryid of the statement which links to pg_stat_statements
  • blockers: the number of blockers
  • blockerpid: the pid of the blocker (if blockers = 1), the pid of one blocker (if blockers > 1)
  • blocker_state: state of the blocker (state of the blockerpid)

Thanks to the queryid field you are able to link the session activity with the sql activity.

The information related to the blocking activity (if any) has been added recently. Why? To easily drill down in case of session being blocked.

Let’s see how we could display some interesting information in case of blocked session(s), for examples:

  • The wait chain
  • The seconds in wait in this chain
  • The percentage of the total wait time that this chain represents

As PostgreSQL provides recursive query and window functions, let’s make use of them to write this query:

postgres@pgu:~$ cat pg_ash_wait_chain.sql
WITH RECURSIVE search_wait_chain(ash_time,pid, blockerpid, wait_event_type,wait_event,level, path)
AS (
          SELECT ash_time,pid, blockerpid, wait_event_type,wait_event, 1 AS level,
          'pid:'||pid||' ('||wait_event_type||' : '||wait_event||') ->'||'pid:'||blockerpid AS path
          from pg_active_session_history WHERE blockers > 0
        union ALL
          SELECT p.ash_time,p.pid, p.blockerpid, p.wait_event_type,p.wait_event, swc.level + 1 AS level,
          'pid:'||p.pid||' ('||p.wait_event_type||' : '||p.wait_event||') ->'||swc.path AS path
          FROM pg_active_session_history p, search_wait_chain swc
          WHERE p.blockerpid = swc.pid and p.ash_time = swc.ash_time and p.blockers > 0
)
select round(100 * count(*) / cnt)||'%' as "% of total wait",count(*) as seconds,path as wait_chain  from (
        SELECT  pid,wait_event,path,sum(count) over() as cnt from (
                select ash_time,level,pid,wait_event,path,count(*) as count, max(level) over(partition by ash_time,pid) as max_level
                FROM search_wait_chain where level > 0 group by ash_time,level,pid,wait_event,path
        ) as all_wait_chain
        where level=max_level
) as wait_chain
group by path,cnt
order by count(*) desc;

Let’s launch this query while only one session is being blocked by another one:

postgres@pgu:~$ psql -f pg_ash_wait_chain.sql
 % of total wait | seconds |                 wait_chain
-----------------+---------+--------------------------------------------
 100%            |      23 | pid:1890 (Lock : transactionid) ->pid:1888
(1 row)

It means that the pid 1890 is waiting since 23 seconds on the transactionid wait event, while being blocked by pid 1888. This wait chain represents 100% of the blocking activity time.

Now another session comes into the game, query the active session history view one more time:

postgres@pgu:~$ psql -f pg_ash_wait_chain.sql
 % of total wait | seconds |                                  wait_chain
-----------------+---------+------------------------------------------------------------------------------
 88%             |     208 | pid:1890 (Lock : transactionid) ->pid:1888
 12%             |      29 | pid:1913 (Lock : transactionid) ->pid:1890 (Lock : transactionid) ->pid:1888
(2 rows)

So we still see our first blocking chain. It is now not the only one (so represents 88% of the blocking activity time).

We can see a new chain that represents 12% of the blocking activity time:

  • pid 1913 (waiting on transactionid) is blocked since 29 seconds by pid 1890 (waiting on transactionid) that is also blocked by pid 1888.

Let’s commit the transaction hold by pid 1888 and launch the query again 2 times:

postgres@pgu:~$ psql -f pg_ash_wait_chain.sql
 % of total wait | seconds |                                  wait_chain
-----------------+---------+------------------------------------------------------------------------------
 57%             |     582 | pid:1890 (Lock : transactionid) ->pid:1888
 40%             |     403 | pid:1913 (Lock : transactionid) ->pid:1890 (Lock : transactionid) ->pid:1888
 3%              |      32 | pid:1913 (Lock : transactionid) ->pid:1890
(3 rows)

postgres@pgu:~$ psql -f pg_ash_wait_chain.sql
 % of total wait | seconds |                                  wait_chain
-----------------+---------+------------------------------------------------------------------------------
 57%             |     582 | pid:1890 (Lock : transactionid) ->pid:1888
 40%             |     403 | pid:1913 (Lock : transactionid) ->pid:1890 (Lock : transactionid) ->pid:1888
 3%              |      33 | pid:1913 (Lock : transactionid) ->pid:1890
(3 rows)

As you can see the first two chains are still displayed (as the query does not filter on ash_time) but are not waiting anymore (seconds does not increase) while the last one (new one) is still waiting (seconds increase).

Remarks

Conclusion

We have seen how the blocking information part of the pg_active_session_history view could help to drill down in case of blocking activity.

PostgreSQL Active Session History extension testing with Docker

Introduction

You may have noticed that a beta version of the pgsentinel extension (providing active session history for postgresql) is publicly available in this github repository.

We can rely on docker to facilitate and automate the testing of the extension on a particular postgreSQL version (has to be >= 10).

Let’s share a Dockerfile so that we can easly build a docker image for testing pgsentinel (on a postgreSQL version of our choice).

Description

The dockerfile used to provision a pgsentinel testing docker image:

  • downloads the postgresql source code (version of your choice)
  • compiles and installs it
  • downloads the pgsentinel extension
  • compiles and installs it
  • compiles and installs the pg_stat_statements extension

Dockerfile github repository

The dockerfile is available in this github repository.

Usage

3 arguments can be used:

  • PG_VERSION (default: 10.5)
  • PG_ASH_SAMPLING (default: 1)
  • PG_ASH_MAX_ENTRIES (default: 10000)

Example to build an image

Let’s build a pgsentinel testing docker image for postgreSQL version 11beta3:

[root@bdtdocker dockerfile]# docker build -t pgsentinel-testing -f Dockerfile-pgsentinel-testing --build-arg PG_VERSION=11beta3 --force-rm=true --no-cache=true .

Once done, let’s run a container

[root@bdtdocker dockerfile]# docker run -d -p 5432:5432 --name pgsentinel pgsentinel-testing

and verify that the pg_active_session_history view is available

[root@bdtdocker dockerfile]# docker exec -it pgsentinel psql -c "\d pg_active_session_history"
                   View "public.pg_active_session_history"
      Column      |           Type           | Collation | Nullable | Default
------------------+--------------------------+-----------+----------+---------
 ash_time         | timestamp with time zone |           |          |
 datid            | oid                      |           |          |
 datname          | text                     |           |          |
 pid              | integer                  |           |          |
 usesysid         | oid                      |           |          |
 usename          | text                     |           |          |
 application_name | text                     |           |          |
 client_addr      | text                     |           |          |
 client_hostname  | text                     |           |          |
 client_port      | integer                  |           |          |
 backend_start    | timestamp with time zone |           |          |
 xact_start       | timestamp with time zone |           |          |
 query_start      | timestamp with time zone |           |          |
 state_change     | timestamp with time zone |           |          |
 wait_event_type  | text                     |           |          |
 wait_event       | text                     |           |          |
 state            | text                     |           |          |
 backend_xid      | xid                      |           |          |
 backend_xmin     | xid                      |           |          |
 top_level_query  | text                     |           |          |
 query            | text                     |           |          |
 cmdtype          | text                     |           |          |
 queryid          | bigint                   |           |          |
 backend_type     | text                     |           |          |
 blockers         | integer                  |           |          |
 blockerpid       | integer                  |           |          |
 blocker_state    | text                     |           |          |

So that we can now test the extension behavior on the postgreSQL version of our choice (11beta3 in this example).

PostgreSQL Active Session History extension is now publicly available

Publicly available

A quick one to let you know that the pgsentinel extension providing active session history sampling is now publicly available.

You can find more details on it into this previous blog post and also from some early beta testers:

Thank you Franck Pachot and Daniel Westermann for beta testing and sharing.

Where to find it?

The extension is available from the pgsentinel github repository. Please keep in mind that at the time of this writing the extension is still in beta so may contain some bugs: don’t hesitate to raise issues at github with your bug report.

Where to follow pgsentinel stuff?

On the website, twitter or github. More stuff to come, stay tuned.

Please do contribute

If you’re lacking of some functionality, then you’re welcome to make pull requests.

PostgreSQL Active Session History (ash): welcome to the pg_active_session_history view (part of the pgsentinel extension)

Why active session history?

What if you could record and query an history of the active sessions? Would not it be useful for performance tuning activities?

With active session history in place you could have a look to the “near” past database activity. You could answer questions like:

  • What wait events type were taking most time?
  • What wait events were taking most time?
  • Which application name was taking most time?
  • What was a session doing?
  • What does a SQL statement wait for?
  • How many sessions were running in CPU?
  • Which database was taking most time?
  • Which backend type was taking most time?
  • On which wait event was the session waiting for?
  • And so on….

How does it look like?

Let’s have a look to the pg_active_session_history view (more details on how to create it later on):

postgres@pgu:~$ /usr/local/pgsql/bin/psql -c "\d pg_active_session_history"
                   View "public.pg_active_session_history"
      Column      |           Type           | Collation | Nullable | Default
------------------+--------------------------+-----------+----------+---------
 ash_time         | timestamp with time zone |           |          |
 datid            | oid                      |           |          |
 datname          | text                     |           |          |
 pid              | integer                  |           |          |
 usesysid         | oid                      |           |          |
 usename          | text                     |           |          |
 application_name | text                     |           |          |
 client_addr      | text                     |           |          |
 client_hostname  | text                     |           |          |
 client_port      | integer                  |           |          |
 backend_start    | timestamp with time zone |           |          |
 xact_start       | timestamp with time zone |           |          |
 query_start      | timestamp with time zone |           |          |
 state_change     | timestamp with time zone |           |          |
 wait_event_type  | text                     |           |          |
 wait_event       | text                     |           |          |
 state            | text                     |           |          |
 backend_xid      | xid                      |           |          |
 backend_xmin     | xid                      |           |          |
 top_level_query  | text                     |           |          |
 query            | text                     |           |          |
 queryid          | bigint                   |           |          |
 backend_type     | text                     |           |          |

You could see it as samplings of pg_stat_activity (one second interval) providing more information:

  • ash_time: the sampling time
  • top_level_query: the top level statement (in case PL/pgSQL is used)
  • query: the statement being executed (not normalised, as it is in pg_stat_statements, means you see the values)
  • queryid: the queryid of the statement (the one coming from pg_stat_statements)

Thanks to the queryid field you will be able to link the session activity with the sql activity (then addressing the point reported by Franck Pachot into this blog post: PGIO, PG_STAT_ACTIVITY and PG_STAT_STATEMENTS)

Installation

pgsentinel uses the pg_stat_statements extension (officially bundled with PostgreSQL) for tracking which queries get executed in your database.

So, add the following entries to your postgres.conf:

shared_preload_libraries = 'pg_stat_statements,pgsentinel'

# Increase the max size of the query strings Postgres records
track_activity_query_size = 2048

# Track statements generated by stored procedures as well
pg_stat_statements.track = all

restart the postgresql daemon and create the extension:

postgres@pgu:~$ /usr/local/pgsql/bin/psql -c "create extension pgsentinel;"
CREATE EXTENSION

Now, the pg_active_session_history view has been created and the activity is being recorded in it.

Let’s see the extension in action during a 2 minutes pgio run:

Remarks

  • No objects are created into the PostgreSQL instance (except the view). The data being queried through the pg_active_session_history view are fully in memory
  • You are able to choose the maximum number of records, once reached, then the data rotate (oldest records are aged out)

Next Steps

  • The library and the source code will be available soon on github in the pgsentinel github repository (under the GNU Affero General Public License v3.0): please do contribute!
  • Once the source code is published, more information on how to create the pgsentinel library will be available
  • Once the source code is published, more information on how to define the maximum of records will be available
  • The extension is named “pgsentinel” because more cool stuff will be added in it in the near future

Conclusion

At pgsentinel we really love performance tuning activity. We will do our best to add valuable performance tuning stuff to the postgresql community: stay tuned

Update 07/14/2018:

The extension is now publicly available.

Measure the impact of DRBD on your PostgreSQL database thanks to pgio (the SLOB method for PostgreSQL)

You might want to replicate a PostgreSQL database thanks to DRBD. In this case you should measure the impact of your DRBD setup, especially if you plan to use DRBD in sync mode. As I am a lucky beta tester of pgio (the SLOB method for PostgreSQL), let’s use it to measure the impact.

DRBD configuration

The purpose of this post is not to explain how to set up DRBD. The DRBD configuration that will be used in this post is the following:

  • Primary host: ubdrbd1
  • Secondary host: ubdrbd2

Configuration:

root@ubdrbd1:/etc# cat drbd.conf
global {
usage-count no;
}
common {
protocol C;
}
resource postgresql {
on ubdrbd1 {
device /dev/drbd1;
disk /dev/sdb1;
address 172.16.170.153:7789;
meta-disk internal;
}
on ubdrbd2 {
device /dev/drbd1;
disk /dev/sdb1;
address 172.16.170.155:7789;
meta-disk internal;
}
}

The C protocol is the synchronous one, so that local write operations on the primary node are considered completed only after both the local and the remote disk write (on /dev/sdb1) have been confirmed.

To ensure that PostgreSQL writes in this replicated device, let’s create a filesystem on it:

root@ubdrbd1:/etc# mkfs.ext4 /dev/drbd1
mke2fs 1.44.1 (24-Mar-2018)
Creating filesystem with 5242455 4k blocks and 1310720 inodes
Filesystem UUID: a7cc203b-39fa-46b3-a707-f330f72ca5b1
Superblock backups stored on blocks:
32768, 98304, 163840, 229376, 294912, 819200, 884736, 1605632, 2654208,
4096000

Allocating group tables: done
Writing inode tables: done
Creating journal (32768 blocks): done
Writing superblocks and filesystem accounting information: done

And mount it, in sync mode, on the postgresql default data location:

root@ubdrbd1:~# mkdir /var/lib/postgresql
root@ubdrbd1:~# mount -o sync /dev/drbd1 /var/lib/postgresql

pgio setup

Once PostgreSQL is up and running, we can setup pgio, this is as easy as that:

postgres@ubdrbd1:~/$ tar -xvf pgio-0.9.tar
postgres@ubdrbd1:~/$ cd pgio

then, edit the configuration file to suit your needs. In our current case, the configuration file being used is the following:

postgres@ubdrbd1:~/pgio$ cat pgio.conf
UPDATE_PCT=10
RUN_TIME=120
NUM_SCHEMAS=1
NUM_THREADS=1
WORK_UNIT=255
UPDATE_WORK_UNIT=8
SCALE=200M
DBNAME=pgio
CONNECT_STRING="pgio"
CREATE_BASE_TABLE=TRUE

As you can see:

  • I want 1 schema and 1 thread by schema
  • I have set UPDATE_PCT so that 10% of calls will do an UPDATE (to test writes, and so DRBD replication impact)
  • I kept the default work unit to read 255 blocks and, for those 10% updates, update 8 blocks only

Now, create the pgio tablespace and pgio database:

postgres=# create tablespace pgio location '/var/lib/postgresql/pgdata';
CREATE TABLESPACE
postgres=# create database pgio tablespace pgio;
CREATE DATABASE

and run setup.sh to load the data:

postgres@ubdrbd1:~/pgio$ ./setup.sh

Job info:      Loading 200M scale into 1 schemas as per pgio.conf->NUM_SCHEMAS.
Batching info: Loading 1 schemas per batch as per pgio.conf->NUM_THREADS.
Base table loading time: 3 seconds.
Waiting for batch. Global schema count: 1. Elapsed: 0 seconds.
Waiting for batch. Global schema count: 1. Elapsed: 13 seconds.

Group data loading phase complete.         Elapsed: 13 seconds.

check the content:

postgres@ubdrbd1:~/pgio$ echo '\d+' | psql pgio
                      List of relations
 Schema |   Name    | Type  |  Owner   |  Size  | Description
--------+-----------+-------+----------+--------+-------------
 public | pgio1     | table | postgres | 200 MB |
 public | pgio_base | table | postgres | 29 MB  |
(2 rows)

Now, let’s run 2 times pgio:

  • One time with DRBD not active
  • One time with DRBD active

For each test, the pgio database will be recreated and the setup will be launched. Also the same pgio run duration will be applied (to compare the exact same things).

First run: DRBD not active

The result is the following:

postgres@ubdrbd1:~/pgio$ ./runit.sh
Date: Sat Jun 2 05:09:46 UTC 2018
Database connect string: "pgio".
Shared buffers: 128MB.
Testing 1 schemas with 1 thread(s) accessing 200M (25600 blocks) of each schema.
Running iostat, vmstat and mpstat on current host--in background.
Launching sessions. 1 schema(s) will be accessed by 1 thread(s) each.
pg_stat_database stats:
datname| blks_hit| blks_read|tup_returned|tup_fetched|tup_updated
BEFORE: pgio | 98053 | 34640 | 34309 | 6780 | 8
AFTER: pgio | 19467796 | 11956992 | 30807460 | 29665212 | 115478
DBNAME: pgio. 1 schemas, 1 threads(each). Run time: 120 seconds. RIOPS >99352< CACHE_HITS/s >161414<

As you can see, 115470 tuples have been updated during this 120 seconds run without DRBD in place.

Second run: DRBD active

For the purpose of this post, let’s simulate “slowness” on the DRBD replication. To do so, we can apply some throttling on the DRBD target device thanks to the blkio cgroup. I would suggest to read Frits Hoogland post to see how it can be implemented.

My cgroup configuration on the DRBD secondary server is the following:

root@ubdrbd2:~# ls -l /dev/sdb
brw-rw---- 1 root disk 8, 16 Jun 1 15:16 /dev/sdb

root@ubdrbd2:~# cat /etc/cgconfig.conf
mount {
blkio = /cgroup/blkio;
}

group iothrottle {
blkio {
blkio.throttle.write_iops_device="8:16 500";
}
}

root@ubdrbd2:~# cat /etc/cgrules.conf
* blkio /iothrottle

Means: we want to ensure that the number of writes per second on /dev/sdb will be limited to 500 for all the processes.

Let’s check that DRDB is active:

root@ubdrbd1:~# drbdsetup status --verbose --statistics
postgresql role:Primary suspended:no
    write-ordering:flush
  volume:0 minor:1 disk:UpToDate
      size:20969820 read:453661 written:6472288 al-writes:215 bm-writes:0 upper-pending:4 lower-pending:0 al-suspended:no blocked:no
  peer connection:Connected role:Secondary congested:no
    volume:0 replication:Established peer-disk:UpToDate resync-suspended:no
        received:0 sent:5161968 out-of-sync:0 pending:4 unacked:0

root@ubdrbd2:~# drbdsetup status --verbose --statistics
postgresql role:Secondary suspended:no
    write-ordering:flush
  volume:0 minor:1 disk:UpToDate
      size:20969820 read:0 written:5296960 al-writes:0 bm-writes:0 upper-pending:0 lower-pending:2 al-suspended:no blocked:no
  peer connection:Connected role:Primary congested:no
    volume:0 replication:Established peer-disk:UpToDate resync-suspended:no
        received:5296968 sent:0 out-of-sync:0 pending:0 unacked:2

With this configuration in place, let’s run pgio on the source machine:

postgres@ubdrbd1:~/pgio$ ./runit.sh
Date: Sat Jun 2 05:37:03 UTC 2018
Database connect string: "pgio".
Shared buffers: 128MB.
Testing 1 schemas with 1 thread(s) accessing 200M (25600 blocks) of each schema.
Running iostat, vmstat and mpstat on current host--in background.
Launching sessions. 1 schema(s) will be accessed by 1 thread(s) each.
pg_stat_database stats:
datname| blks_hit| blks_read|tup_returned|tup_fetched|tup_updated
BEFORE: pgio | 111461 | 44099 | 35967 | 5640 | 6
AFTER: pgio | 3879414 | 2132201 | 5799491 | 5766888 | 22425
DBNAME: pgio. 1 schemas, 1 threads(each). Run time: 120 seconds. RIOPS >17400< CACHE_HITS/s >31399<

As you can see, 22419 tuples have been updated during this 120 seconds run with DRBD and blkio throttling in place (this is far less than the 115470 observed in the first test).

pgio also provides snapshots of iostat, vmstat and mpstat, so that it is easy to check that the throttling was in place (writes per second < 500 on the source due to the throttling on the target):

Device            r/s     w/s     rMB/s     wMB/s   rrqm/s   wrqm/s  %rrqm  %wrqm r_await w_await aqu-sz rareq-sz wareq-sz  svctm  %util
sdb              0.00  425.42      0.00      3.20     0.00    84.41   0.00  16.56    0.00    0.18   0.08     0.00     7.71   0.16   6.64
sdb              0.00  415.18      0.00      3.16     0.00    74.92   0.00  15.29    0.00    0.20   0.08     0.00     7.80   0.17   7.26
.
.

compares to:

Device            r/s     w/s     rMB/s     wMB/s   rrqm/s   wrqm/s  %rrqm  %wrqm r_await w_await aqu-sz rareq-sz wareq-sz  svctm  %util
sdb              0.00 1311.07      0.00     10.14     0.00    62.98   0.00   4.58    0.00    0.10   0.14     0.00     7.92   0.10  13.70
sdb              0.00 1252.05      0.00      9.67     0.00    62.33   0.00   4.74    0.00    0.11   0.13     0.00     7.91   0.10  13.01
.
.

with DRBD and throttling, both not in place.

So?

Thanks to pgio, we have been able to measure the impact of our DRBD replication setup on PostgreSQL by executing the exact same workload during both tests. We simulated a poor performing DRBD replication by using blkio throttling on the secondary node.

Want to read more about pgio?

Sneak Preview of pgio (The SLOB Method for PostgreSQL) Part I: The Beta pgio README File.

Sneak Preview of pgio (The SLOB Method for PostgreSQL) Part II: Bulk Data Loading.

Sneak Preview of pgio (The SLOB Method for PostgreSQL) Part III: Link To The Full README file for Beta pgio v0.9.

Sneak Preview of pgio (The SLOB Method for PostgreSQL) Part IV: How To Reduce The Amount of Memory In The Linux Page Cache For Testing Purposes.

https://blog.dbi-services.com/postgres-the-fsync-issue-and-pgio-the-slob-method-for-postgresql/

https://blog.dbi-services.com/which-bitnami-service-to-choose-in-the-oracle-cloud-infrastructure/

demystifying and wrapping the oracle cloud APIs with Python

As an oracle DBA you might have to deal with REST API, especially when working with the cloud. The purpose of this post is to demystify the REST API usage from a DBA point of view. Let’s take an example and write a Python wrapper to automate the Instance creation in the Oracle Database Cloud Service.

The instance creation can be done manually using the Web Interface that way:

It could also been done using the APIs. The APIs are described in this link. The one related to the Instance creation is the following:

So, identityDomainId is a path parameter, the Authorization and X-ID-TENANT-NAME are header parameters and the body describes the parameters in JSON format.

To interact with the APIs through HTTP, let’s use the Python Requests module.

To work with JSON let’s use the JSON one.

First, we need to create an http session. Let’s import the requests module:

import requests

and then create the http session:

client = requests.Session()

Once done, we can add the authorization:

client.auth = (USERNAME, PASSWORD)

and update the header with the content-type and the X-ID-TENANT-NAME:

client.headers.update(
  {'content-type': 'application/json'
   'X-ID-TENANT-NAME':'{0}'.format(IDENTITY_DOMAIN_ID)})

Now, let’s create the body. In this example the JSON data has been extracted from a file (prov_database.json) that contains:

$ cat prov_database.json
{
  "description": "BDTDESC",
  "edition": "EE",
  "level": "PAAS",
  "serviceName": "WILLBEOVERWRITTEN",
  "shape": "oc3",
  "subscriptionType": "MONTHLY",
  "version": "12.1.0.2",
  "vmPublicKeyText": "ssh-rsa <YOURKEY>",
  "parameters": [
    {
      "type": "db",
      "usableStorage": "15",
      "adminPassword": "<YOURPWD>",
      "sid": "BDTSID",
      "pdbName": "MYPDB",
      "failoverDatabase": "no",
      "backupDestination": "NONE"
    }
  ]
}

It has been extracted in the Python wrapper that way:

data = json.load(open('{0}/prov_database.json'.format(dir_path), 'r'))

Now that we have defined the authorization, the header and the body, all we have to do is to post to http.

The url structure is described here:

So that the post is launched that way with Python:

response = client.post("https://dbcs.emea.oraclecloud.com/paas/service/dbcs/api/v1.1/instances/{0}".format(IDENTITY_DOMAIN_ID), json=data)

As you can see the IDENTITY_DOMAIN_ID is also a path parameter and the data is part of the request. That’s it!

Remarks:

  • The username, password and identityDomainId have also been extracted from a file (.oracleapi_config.yml). The file contains:
$ cat .oracleapi_config.yml
identityDomainId: <YOURS>
username: <YOURS>
password: <YOURS>
logfile: oracleapi.log

and has been extracted that way:

f = open('{0}/.oracleapi_config.yml'.format(dir_path), 'r')
config = safe_load(f)
IDENTITY_DOMAIN_ID = config['identityDomainId']
USERNAME = config['username']
PASSWORD = config['password']
  • More fun:
    You may have noticed that the http post’s response provides a link to an URL you can use to check the progress of the creation

So that we can integrate the check in our wrapper (the source code is available at the end of this post and in this git repository).

Let’s use our wrapper:

$ python ./opc_api_wrapper.py
Usage:
    opc_api_wrapper.py <service_name> create_instance

$ python ./opc_api_wrapper.py BDTSERV create_instance
creating opc instance BDTSERV...
InProgress (Starting Compute resources...)
InProgress (Configuring Oracle Database Server...)
Succeeded ( Service Reachabilty Check (SRC) of Oracle Database Server [BDTSERV] completed...)

opc instance BDTSERV created:

SSH access to VM [DB_1/vm-1] succeeded...
Oracle Database Server Configuration completed...
Successfully provisioned Oracle Database Server...
Service Reachabilty Check (SRC) of Oracle Database Server [BDTSERV] completed...

During the instance creation, you could also check the progress through the web interface:

Source code:

# Author: Bertrand Drouvot
# Blog : https://bdrouvot.wordpress.com/
# opc_api_wrapper.py : V1.0 (2018/05)
# Oracle cloud API wrapper

from yaml import safe_load
import os
from os import path
import logging
import json
import requests
import time
from docopt import docopt

FORMAT = '%(asctime)s - %(name)s - %(levelname)-s %(message)s'

help = ''' Oracle Public Cloud Wrapper

Usage:
    opc_api_wrapper.py <service_name> create_instance

Options:
    -h  Help message

    Returns .....
'''

class APIError(Exception):

    def __init__(self, message, status_code=None, payload=None):
        Exception.__init__(self)
        self.message = message
        self.status_code = 415

    def to_dict(self):
        rv = dict()
        rv['message'] = self.message
        return rv

def launch_actions(kwargs):

    dir_path = os.path.dirname(os.path.realpath(__file__))
    try:
        f = open('{0}/.oracleapi_config.yml'.format(dir_path), 'r')
        config = safe_load(f)
    except:
        raise ValueError("This script requires a .oracleapi_config.yml file")
        exit(-1)

    if kwargs['create_instance']:
        create_instance(kwargs['service_name'],dir_path,config)

def return_last_from_list(v_list):
    for msg in (v_list[0], v_list[-1]):
        pass
    return msg

def print_all_from_list(v_list):
    for mmsg in v_list:
        print mmsg

def check_job(config,joburl):

    IDENTITY_DOMAIN_ID = config['identityDomainId']
    USERNAME = config['username']
    PASSWORD = config['password']

    client = requests.Session()
    client.auth = (USERNAME, PASSWORD)
    client.headers.update({'X-ID-TENANT-NAME': '{0}'.format(IDENTITY_DOMAIN_ID)})

    response = client.get("{0}".format(joburl))
    jsontext= json.loads(response.text)
    client.close()
    return (jsontext['job_status'],jsontext['message'])


def create_instance(service_name,dir_path,config):

    logfile = config['logfile']
    logging.basicConfig(filename=logfile, format=FORMAT, level=logging.INFO)

    IDENTITY_DOMAIN_ID = config['identityDomainId']
    USERNAME = config['username']
    PASSWORD = config['password']

    data = json.load(open('{0}/prov_database.json'.format(dir_path), 'r'))
    data['serviceName'] = service_name

    print "creating opc instance {0}...".format(service_name)

    client = requests.Session()
    client.auth = (USERNAME, PASSWORD)
    client.headers.update(
        {'content-type': 'application/json',
         'X-ID-TENANT-NAME':'{0}'.format(IDENTITY_DOMAIN_ID)})

    response = client.post("https://dbcs.emea.oraclecloud.com/paas/service/dbcs/api/v1.1/instances/{0}".format(IDENTITY_DOMAIN_ID), json=data)
    if response.status_code != 202:
        raise APIError(response.json()['message'])
    jobburl = response.headers['Location']
    jobsstatus = "InProgress"
    while (jobsstatus == "InProgress"):
        time.sleep(120)
        jobsstatus,jobmessage = check_job(config,jobburl)
        print "{0} ({1})".format(jobsstatus,return_last_from_list(jobmessage))
    client.close()
    print ""
    print "opc instance {0} created:".format(service_name)
    print ""
    print_all_from_list(jobmessage)

#
# Main
#

def main():

    arguments = docopt(help)
    for key in arguments.keys():
        arguments[key.replace('<','').replace('>','')] = arguments.pop(key)

    launch_actions(arguments)

if __name__ == '__main__':
    main()

Conclusion

We have been able to wrap the instance creation APIs with Python. We have also included a way to check/follow the creation progress. Wrapping the APIs with Python gives flexibility, for example you could launch ansible playbook(s) from the wrapper once the instance creation is done.

Visualize PostgreSQL index file with pgdfv

Introduction

In the previous blog post pgdfv (PostgreSQL data file visualizer) has been introduced. At that time the utility was able to display data file. It is now able to display index file. If you are not familiar with PostgreSQL block internals I would suggest to read Frits Hoogland study in this series of blogposts.

The utility usage is:

$ ./pgdfv
-df     Path to a datafile (mandatory if indexfile is used)
-if     Path to an indexfile
-b      Block size (default 8192)

As you can see you can now specify an indexfile. In that case the following information will be displayed:

  • The percentage of free space within an index page
  • The percentage of current rows an index page refers to
  • The percentage of HOT redirect rows an index page refers to

It works for B-tree index and will display those informations for the leaf blocks only.

As a picture is worth a thousand words, let’s see some examples.

Examples

Let’s create a table, an index, insert 4 rows:

pgdbv=# create table bdtable(id int not null, f varchar(30) );
CREATE TABLE
pgdbv=# insert into bdtable ( id, f ) values (1, 'aaaaaaaaaa'), (2, 'bbbbbbbbbb'), (3, 'cccccccccc'), (4, 'dddddddddd');
INSERT 0 4
pgdbv=# create index bdtindex on bdtable (f);
CREATE INDEX

and inspect the table and index content:

pgdbv=# select * from heap_page_items(get_raw_page('bdtable',0));
 lp | lp_off | lp_flags | lp_len | t_xmin | t_xmax | t_field3 | t_ctid | t_infomask2 | t_infomask | t_hoff | t_bits | t_oid |              t_data
----+--------+----------+--------+--------+--------+----------+--------+-------------+------------+--------+--------+-------+----------------------------------
  1 |   8152 |        1 |     39 |   2489 |      0 |        0 | (0,1)  |           2 |       2050 |     24 |        |       | \x010000001761616161616161616161
  2 |   8112 |        1 |     39 |   2489 |      0 |        0 | (0,2)  |           2 |       2050 |     24 |        |       | \x020000001762626262626262626262
  3 |   8072 |        1 |     39 |   2489 |      0 |        0 | (0,3)  |           2 |       2050 |     24 |        |       | \x030000001763636363636363636363
  4 |   8032 |        1 |     39 |   2489 |      0 |        0 | (0,4)  |           2 |       2050 |     24 |        |       | \x040000001764646464646464646464
(4 rows)

pgdbv=# select * from bt_page_items('bdtindex',1);
 itemoffset | ctid  | itemlen | nulls | vars |                      data
------------+-------+---------+-------+------+-------------------------------------------------
          1 | (0,1) |      24 | f     | t    | 17 61 61 61 61 61 61 61 61 61 61 00 00 00 00 00
          2 | (0,2) |      24 | f     | t    | 17 62 62 62 62 62 62 62 62 62 62 00 00 00 00 00
          3 | (0,3) |      24 | f     | t    | 17 63 63 63 63 63 63 63 63 63 63 00 00 00 00 00
          4 | (0,4) |      24 | f     | t    | 17 64 64 64 64 64 64 64 64 64 64 00 00 00 00 00
(4 rows)

In PostgreSQL, each table is stored in a separate file. When a table exceeds 1 GB, it is divided into gigabyte-sized segments.

Let’s check which file contains the table and which one contains the index:

pgdbv=# SELECT pg_relation_filepath('bdtable');
 pg_relation_filepath
----------------------
 base/16416/16497
(1 row)

pgdbv=# SELECT pg_relation_filepath('bdtindex');
 pg_relation_filepath
----------------------
 base/16416/16503
(1 row)

So that we can use the utility on those files that way:

So the data block has been displayed (same behavior as the previous blog post) and also 2 index blocks.

The index block display can be :

  • a letter or a question mark: M for meta-page, R for root page and ? for “non root, non meta and non leaf”.
  • a number: It represents the percentage of HOT redirect rows the index refers to (instead of unused rows as it is the case for the data block).

The number is displayed only in case of a leaf block.

So, one leaf index block has been detected with more than 75% of free space (so the green color), more than 50% of the rows the index refers to are current (100% in our case as tx_max = 0 for all the rows) and HOT redirect are less than 10% (0 is displayed) (0% in our case as no rows with lp_flags = 2).

Let’s update 3 rows: one update on the indexed column and 2 updates on the non indexed column:

pgdbv=# update bdtable set f='aqwzsxedc' where id =1;
UPDATE 1
pgdbv=# update bdtable set id=id+10 where id in (2,3);
UPDATE 2
pgdbv=# checkpoint;
CHECKPOINT
pgdbv=# select * from heap_page_items(get_raw_page('bdtable',0));
 lp | lp_off | lp_flags | lp_len | t_xmin | t_xmax | t_field3 | t_ctid | t_infomask2 | t_infomask | t_hoff | t_bits | t_oid |              t_data
----+--------+----------+--------+--------+--------+----------+--------+-------------+------------+--------+--------+-------+----------------------------------
  1 |   8152 |        1 |     39 |   2489 |   2490 |        0 | (0,5)  |           2 |       1282 |     24 |        |       | \x010000001761616161616161616161
  2 |   8112 |        1 |     39 |   2489 |   2491 |        0 | (0,6)  |       16386 |        258 |     24 |        |       | \x020000001762626262626262626262
  3 |   8072 |        1 |     39 |   2489 |   2491 |        0 | (0,7)  |       16386 |        258 |     24 |        |       | \x030000001763636363636363636363
  4 |   8032 |        1 |     39 |   2489 |      0 |        0 | (0,4)  |           2 |       2306 |     24 |        |       | \x040000001764646464646464646464
  5 |   7992 |        1 |     38 |   2490 |      0 |        0 | (0,5)  |           2 |      10498 |     24 |        |       | \x01000000156171777a7378656463
  6 |   7952 |        1 |     39 |   2491 |      0 |        0 | (0,6)  |       32770 |      10242 |     24 |        |       | \x0c0000001762626262626262626262
  7 |   7912 |        1 |     39 |   2491 |      0 |        0 | (0,7)  |       32770 |      10242 |     24 |        |       | \x0d0000001763636363636363636363
(7 rows)

pgdbv=# select * from bt_page_items('bdtindex',1);
 itemoffset | ctid  | itemlen | nulls | vars |                      data
------------+-------+---------+-------+------+-------------------------------------------------
          1 | (0,1) |      24 | f     | t    | 17 61 61 61 61 61 61 61 61 61 61 00 00 00 00 00
          2 | (0,5) |      24 | f     | t    | 15 61 71 77 7a 73 78 65 64 63 00 00 00 00 00 00
          3 | (0,2) |      24 | f     | t    | 17 62 62 62 62 62 62 62 62 62 62 00 00 00 00 00
          4 | (0,3) |      24 | f     | t    | 17 63 63 63 63 63 63 63 63 63 63 00 00 00 00 00
          5 | (0,4) |      24 | f     | t    | 17 64 64 64 64 64 64 64 64 64 64 00 00 00 00 00
(5 rows)

And launch the tool again:

As you can see we still have more than 75% of free space in the leaf index block but the way to display the color has been changed (because now less than 50% of the rows the index refers to are current aka tx_max = 0) and HOT redirect is still less than 10% (0 is displayed).

Let’s vacuum the table:

pgdbv=# vacuum  bdtable;
VACUUM
pgdbv=# checkpoint;
CHECKPOINT
pgdbv=# select * from heap_page_items(get_raw_page('bdtable',0));
 lp | lp_off | lp_flags | lp_len | t_xmin | t_xmax | t_field3 | t_ctid | t_infomask2 | t_infomask | t_hoff | t_bits | t_oid |              t_data
----+--------+----------+--------+--------+--------+----------+--------+-------------+------------+--------+--------+-------+----------------------------------
  1 |      0 |        0 |      0 |        |        |          |        |             |            |        |        |       |
  2 |      6 |        2 |      0 |        |        |          |        |             |            |        |        |       |
  3 |      7 |        2 |      0 |        |        |          |        |             |            |        |        |       |
  4 |   8152 |        1 |     39 |   2489 |      0 |        0 | (0,4)  |           2 |       2306 |     24 |        |       | \x040000001764646464646464646464
  5 |   8112 |        1 |     38 |   2490 |      0 |        0 | (0,5)  |           2 |      10498 |     24 |        |       | \x01000000156171777a7378656463
  6 |   8072 |        1 |     39 |   2491 |      0 |        0 | (0,6)  |       32770 |      10498 |     24 |        |       | \x0c0000001762626262626262626262
  7 |   8032 |        1 |     39 |   2491 |      0 |        0 | (0,7)  |       32770 |      10498 |     24 |        |       | \x0d0000001763636363636363636363
(7 rows)

pgdbv=# select * from bt_page_items('bdtindex',1);
 itemoffset | ctid  | itemlen | nulls | vars |                      data
------------+-------+---------+-------+------+-------------------------------------------------
          1 | (0,5) |      24 | f     | t    | 15 61 71 77 7a 73 78 65 64 63 00 00 00 00 00 00
          2 | (0,2) |      24 | f     | t    | 17 62 62 62 62 62 62 62 62 62 62 00 00 00 00 00
          3 | (0,3) |      24 | f     | t    | 17 63 63 63 63 63 63 63 63 63 63 00 00 00 00 00
          4 | (0,4) |      24 | f     | t    | 17 64 64 64 64 64 64 64 64 64 64 00 00 00 00 00
(4 rows)

and launch the utility:

As you can see we still have more than 75% of free space. Now more than 50% of the rows the index refers to are current. The index refers to between 50 and 60% of HOT redirect rows (so 5 is displayed) (for ctid (0,2) and (0,3): so 2 rows out of 4 the index refers to).

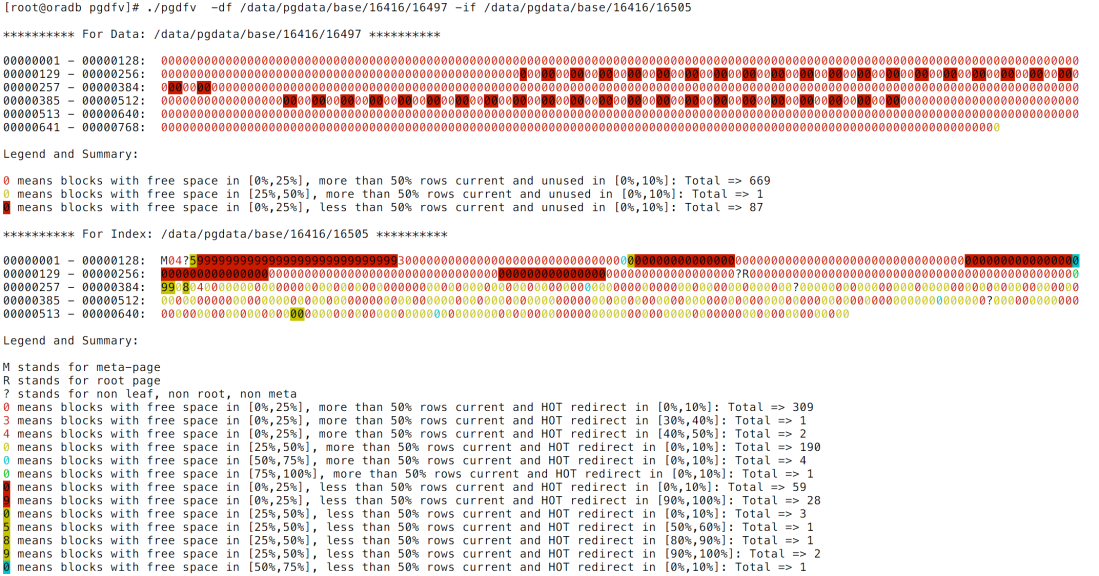
The legend and summary are dynamic and depend of the contents of the scanned blocks (data and index).

For example on a table made of 757 blocks, you could end up with something like:

The same table, once FULL vacuum would produce:

Remarks

  • The tool is available in this repository.
  • The tool is for B-tree index only.
  • The tool is 100% inspired by Frits Hoogland blogpost series and by odbv (written by Kamil Stawiarski) that can be used to visualize oracle database blocks.

Conclusion

pgdfv can now be used to visualize PostgreSQL data and index file pages.